A School may have to Close due to Lack of Funding. How has it come to this?

The Sacred Heart Junior National School in Killinarden, Tallaght wrote to families to let them know that due to a serious lack of funding, they would be forced to operate remotely from April 1st. This was because of “massive under funding for many years due to cuts from the Department of Education” and they said they would no longer be able to pay basic bills unless it received additional money.
How has it come to this?
Before I do, I should explain how primary schools are funded. In its simplest of terms, every child that enrols in a school is worth a certain amount of money and this is paid to the school from the Department of Education in the form of, what’s called, a Capitation Grant. This grant is used to pay for every bill, every resource, almost everything. For example, schools don’t get any extra money to pay for cleaning the school. The cleaner and all cleaning materials comes from the same grant. From about 2020 to 2023, this equated to €183 per pupil so a 100-pupil school’s entire budget for bills, resources and most other things would have been €18,300.
€18,300 for heating, lighting, insurance, cleaning, phone bills, and so on.
In case you are wondering about other money that comes to schools, there are grants to pay for standardised testing booklets, the wages of the school secretary, and a very partial payment for any school lucky to be able to afford a caretaker. Teachers and SNAs (and more recently most secretaries) are paid directly by the Department of Education.
The schoolbook grant also partially pays for school books, but only partially, and this was cut after one year by 17%. Some schools that fall under DEIS get an extra grant but this is only to be used to tackle disadvantage. Finally, there are very small grants for ICT and repairs each year, which aren’t ever guaranteed.
In effect, a 100-pupil school is only getting €18,300 per year for everything else. And people wonder why schools seem to be constantly fundraising!
To give some context, by coincidence, I worked in the school directly beside it from 2001 to 2002. Back then the capitation grant seemed more paltry at €105 per pupil, and it represented a €10 increase. In terms of inflation, this grant is the equivalent of €167 roughly. If we look at a graph of capitation grant rates as well as their value adjusted for inflation based on CSO figures, we can see that this year’s allocation is still nowhere near where we were and even next year’s allocation, which is a €24 increase, still doesn’t come close.

These figures alone show that up until the recession, there was significant progress in trying to reach a level of sustainability for schools but they took a large dip and have teetered at below today’s capitation grant, which is still a long way off where it once was. It’s even less close to where it needs to be.
However, the stats are probably a little bit meaningless if we don’t compare them to how the money is supposed to be broken down. Without asking a school to search through their bills over the last 25 years and sharing them with me, we can probably work off average data from Ireland in other contexts.
Official data from the SEAI website shows that electricity prices have gone up significantly in the last few years.

Taking this data alone we can compare the data to see how electricity costs per unit compare to the capitation grant. As we can see, electricity costs increased significantly over the last 5 years in particular. However, in order to analyse the impact this had with the capitation grant, we need to make an assumption. We are going to assume that in 2007, electricity accounted for 10% of the capitation grant. It doesn’t really matter what percentage we assume, the interesting part will be how it increases and decreases based on the capitation grant and, hopefully, why we’re seeing how schools are having financial issues.
For the mathematicians and statisticians out there, here’s the explanation in geeky language. (You can skip this if you like!) From the assumption of 10% in 2007, we calculated the average electricity consumption per pupil by dividing 10% of the 2007 grant by the 2007 electricity cost per kWh. This gives us a constant kWh value that represents per-pupil consumption. For subsequent years, we multiplied this constant consumption by that year’s cost per kWh to determine the electricity cost per pupil. Finally, we divided this cost by the capitation grant for that year and multiplied by 100 to express it as a percentage of the grant.
More importantly is the result.
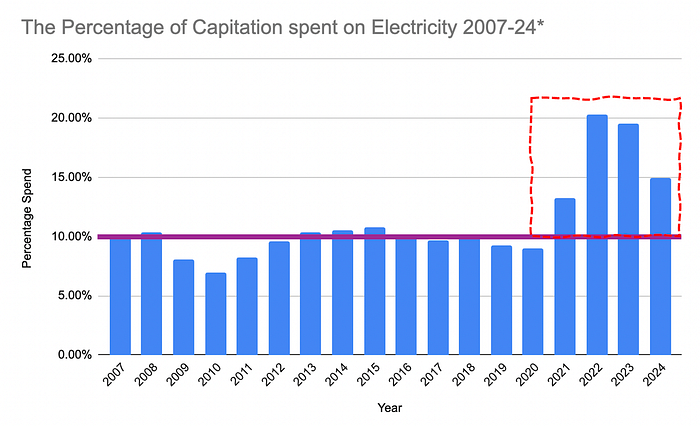
As you can clearly see, from 2007 until about 2020, the cost of electricity was fairly stable, and even was quite good for the first part of the recession but since 2021, the cost of electricity as a percentage of the capitation grant has doubled!
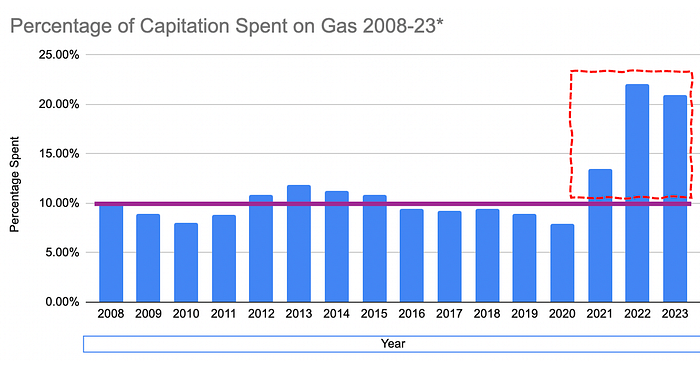
Looking at gas using the same metrics, it’s a similar situation.
It’s hard to find other official data on other costs and the closest I could find was on a site called Numbeo, which gives a good guideline on a number of items over the last 15 years.
However, on electricity and gas prices alone, I think it’s pretty clear what’s been happening.
Evidence also suggests that insurance costs for schools has gone up considerably in the last two and a half decades. This article from 2004 suggests that even back then, insurance costs were a major issue.
In 2019, several special schools had to seek emergency funding.
One school’s insurance had risen from €3,000 to over €26,000 from 2017 to 2019. I wrote to an insurance company to ask for some details regarding insurance costs but was told this information would not be forthcoming.
Looking at cleaning staff, even if schools are paying minimum wage, it is interesting to compare its increase compared to the capitation grant’s.
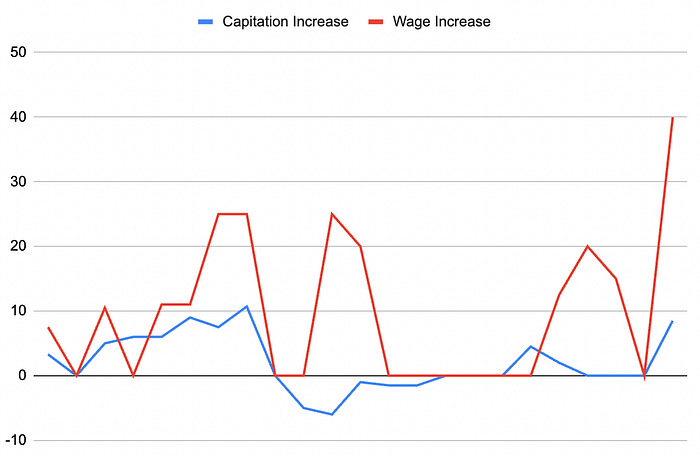
In almost all years, the rate of increase in minimum wage was far greater than the capitation grant. On average since 2001, there has been a 2% increase in capitation grant compared to a 9% increase in minimum wage. This means schools have to absorb the extra cost of cleaner staff.
With all this in mind, it’s very clear why the school in Killinarden found themselves in financial trouble.
It wouldn’t be an article by me if I didn’t point out the “Sacred Heart” aspect of this story. I am often told by people that the Catholic Church provides funding to schools. I know this isn’t true but it would be remiss of me not to mention it. The Department of Education funds every single cent that goes into every school whether religious or not. The vast majority of Catholic schools own the land that the school is built on and this means that every single one of those cents is gifted to the Catholic church. It’s not the main point of this article, and I wasn’t even going to add it in, but given that the Catholic church hasn’t seen fit to save their own school from bankruptcy, I feel it needed to be said. (I also know this will mean people won’t share this as much as they would without this paragraph.)
Ultimately, this article isn’t giving you anything you probably didn’t already know but it puts some numbers behind it and people that are much cleverer than me can possibly use those figures to calculate how much the capitation grant should be.